This is a follow-up post on https://kartoza.com/en/blog/create-a-custom-reference-grid-in-qgis-composer/.
This post outlines how to make dynamic grids that are aligned to the lat long graticule.
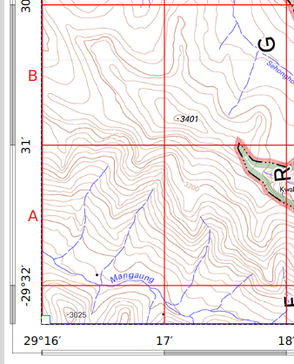
Create one grid to show the lines with intervals in decimal degrees.
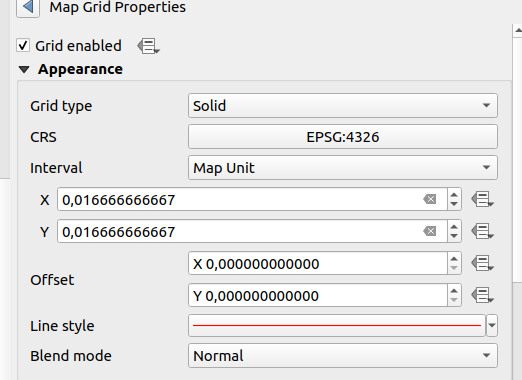
Create another grid to show the labels in the center of the visible grid cells. Note the offset is set to half the interval and we don't draw the lines.
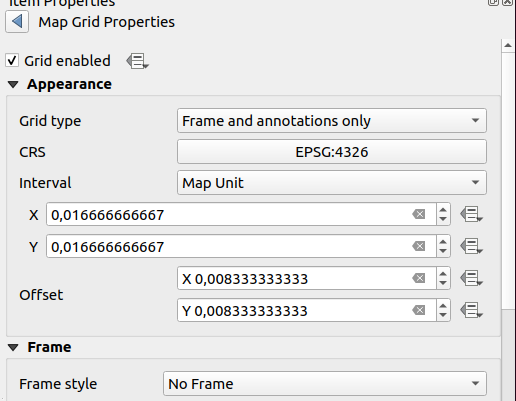
Navigate to the label setting for the second grid and choose the following.
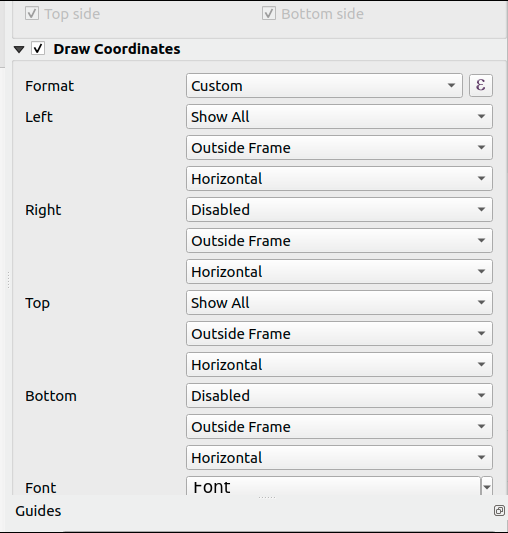
Click expression builder on custom.
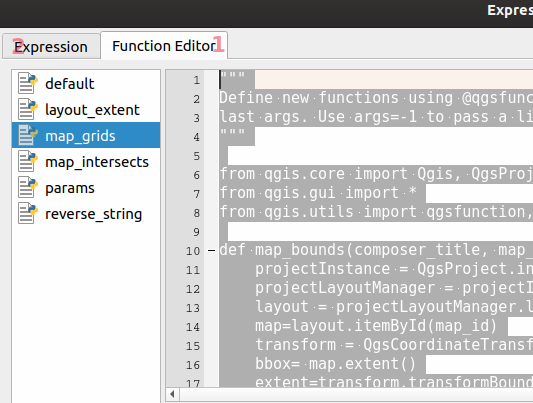
Click on the function editor and create a new function. Populate the contents with following https://gist.github.com/NyakudyaA/c2cf728e2906288e0448f82cb3c5a077 and save your changes.
Click on the expression and enter the following:
CASE
 WHEN @GRID_AXIS = 'y' THEN SUBSTR('ABCDEFGHIJKLMNOPQRST',
 (
   @GRID_NUMBER - TO_INT(MAP_Y_MIN( 'A4 portrait', 'main') / 0.016666666667)*0.016666666667 + 0.008333333000
 )
 / 0.016666666667, 1)
 WHEN @GRID_AXIS = 'x' THEN ROUND(
 (
   @GRID_NUMBER - TO_INT( MAP_X_MIN( 'A4 portrait', 'main') / 0.016666666667)*0.016666666667 + 0.008333333000
 ) / 0.016666666667, 2)
END
The parameters for the map labels are explained below:

* A = Composer title
* B = Item ID for the map
* C = Grid Interval in lat long (calculated as (1/60) to get a minute grid)
* D = Grid offset in lat long ( calculated as half of the Grid interval)
* E = Custom python function ( Copied from https://gist.github.com/NyakudyaA/c2cf728e2906288e0448f82cb3c5a077 )
Your map will be labelled accordingly now.
NB: The script for labelling assumes that your map CRS is 3857. So it will transform the bounding box from EPSG:3857 to EPSG:4326. If your map is using another CRS you can change the following https://gist.github.com/NyakudyaA/c2cf728e2906288e0448f82cb3c5a077#file-map_grids-py-L15
The script also assumes the map has an item id assigned. Many users do not know the significance of adding the Item ID for each map element.

 Kartoza
Comments
There are currently no comments
New Comment